Appearance
The Problem: Analytics Chaos is Everywhere 🌪️
Every product org I know of has run into the same challenges while trying to scale their product analytics.
- Inconsistent tracking across teams and features.
- No taxonomy enforcement across hundreds of events & properties.
- Knowledge silos where only a few people understand the data.
- Broken dashboards when someone changes an event or property name.
- Hours wasted on investigations to figure out why & where an event broke.
- Stale documentation that nobody trusts or maintains.
After more than a decade in tech, I've seen these problems repeated time & time again. Some orgs live with the pain, while others create archaic data councils whom gate keep all decisions related to analytics.
I first encountered these problems in 2017 while working on the growth team at HubSpot. Being tasked with figuring out a platform wide solution, I had an opportunity to work with PMs, engineers, & analysts to build self-documenting analytics infrastructure that solved all of these problems. And it worked. Knowledge silos came down, data quality went up, and the true value of product analytics data was unlocked.
This was the catalyst that ultimately lead to Voltage. Voltage is a 100% free open source suite of tools that enable self-documenting & type-safe analytics tracking. Much like ORMs such as Prisma, Voltage works by generating typescript types & documentation from schema files. Perhaps most importantly, Voltage is based on tried & true principles that have been proven to scale.
See Voltage in Action:
- For Developers: How Voltage Works (with gifs)
- For PMs & Analysts: Sample Auto-Documentation
The Journey to Data Maturity 🧙♂️
Most organizations treat analytics as an afterthought, where more time is spent putting out fires than preventing them. As a product & analytics org scales, these costs compound, and the way the org approaches analytics evolves.
During this evolution, organizations typically progress through similar stages of data maturity. Most get stuck somewhere between stages 2-4, with some platform-forward orgs making it all the way to stage 6, and sometimes 7.
Stage 1: No Tracking
Teams fly blind with no data.
Stage 2: Basic Tracking
Teams add analytics as needs arise.
Stage 3: Chaotic Tracking
The data is there, but so is the chaos & knowledge silos.
Stage 4: Organized Taxonomy
Data quality champions have laid the ground rules of taxonomy. Chaos is down, but knowledge silos are still up.
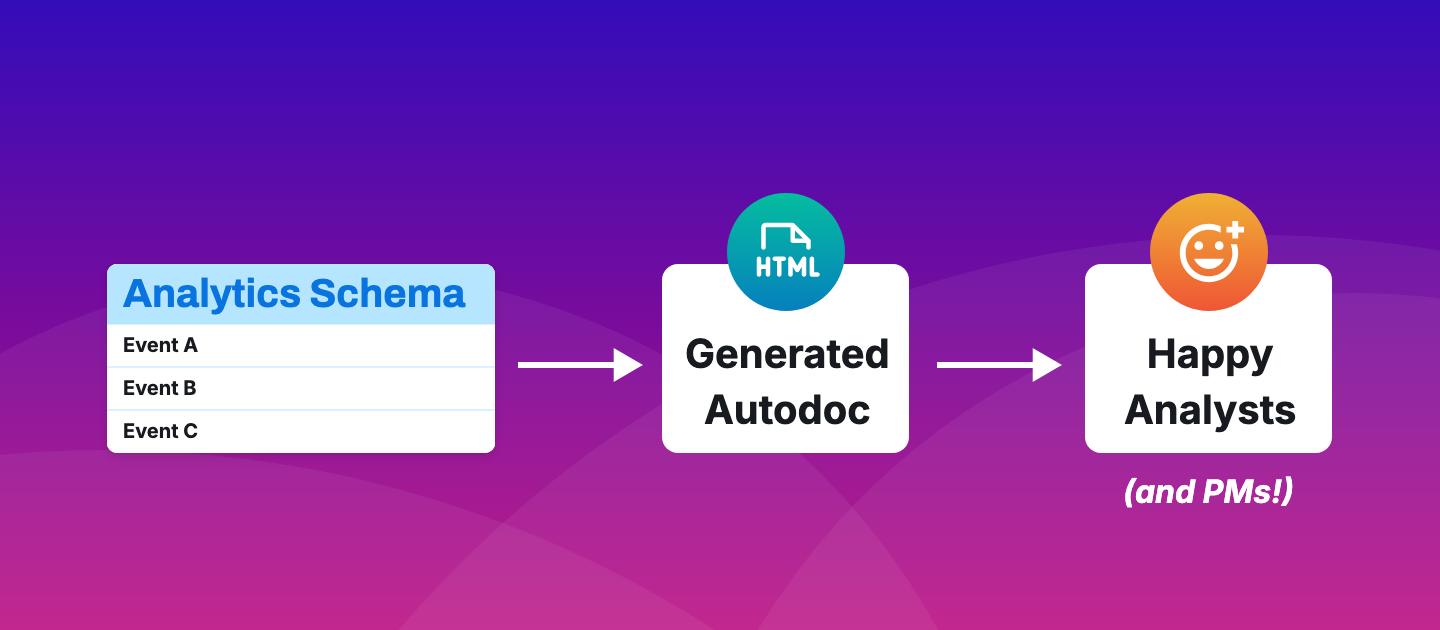
Stage 5: Self-Documenting Analytics
As the app evolves, a never-stale autodoc of analytics taxonomy gets generated from schemas.
Stage 6: Augmented Analytics
Analytics data becomes part of an interconnected platform to power workflows & in-app personalization.
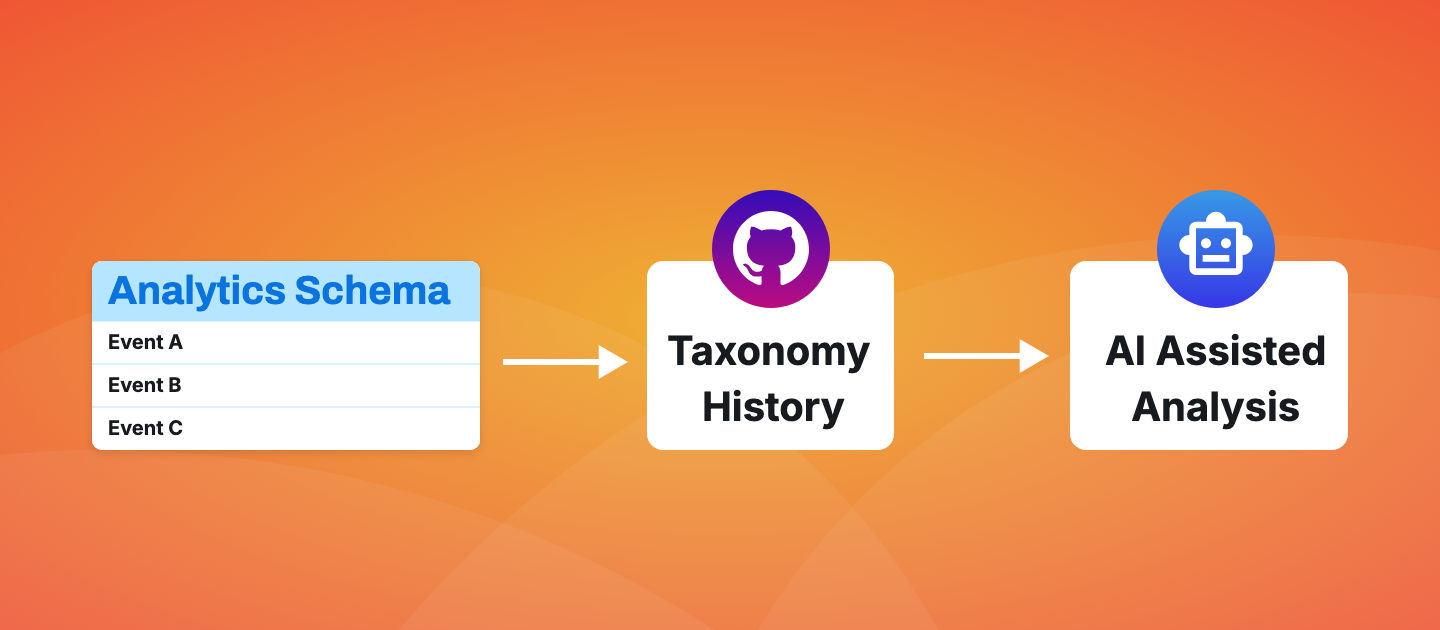
Stage 7: AI Ready Analytics
Evolutionary schema context is generated for use by AI agents, so that over time they get increasingly better at analyzing & understanding your data.
Scaling from stage 2 → 7 with Voltage ⚡
Voltage is designed to help your organization scale from stage 2 all the way to stage 7 while following industry standard best practices. No large analytics engineering teams or budgets needed. All you need is Voltage, and one motivated data champion to lay the foundation.
Unlocking AI-Ready Analytics 🤖
Stage 7 of the data maturity journey represents an exciting new chapter for analytics teams. Imagine an AI analyst that could auto-explore your analytics for you. 📈
But here's the thing: AI cannot reliably deliver impactful analysis without fully understanding the context of:
- How software changes for different types of users & plans
- What analytics events get tracked, for who, & when
- How this tracking evolves over time
Without this context, an AI analyst will always deliver terrible signal-to-noise ratio, because it can't separate data effects stemming from user behavior vs. app changes. Without the context, the result is an AI agent that constantly digs up false findings, and only sometimes finds something useful.
But with this context, AI can deliver consistently insightful findings driven by real behavioral trends.
Voltage provides exactly this context as structured JSON for any app. It captures not just what you're tracking today, but the evolutionary story of how your analytics taxonomy changes over time.
This is what makes analytics truly "AI-ready" — not just clean data, but rich contextual understanding that starts with your source code.
Join the Movement 📢
Analytics doesn't have to be chaotic. With the right tools and practices, every organization can achieve data maturity and build AI-ready analytics infrastructure.
Try Voltage today:
We can't wait to see what you build with clean, structured, AI-ready analytics. The future of data-driven decision making starts with good tracking infrastructure, and good tracking infrastructure starts with Voltage. 📈
Future Development </>
The cornerstone of Voltage is it's schema design & codegen. It is critical that codebases not be required to re-organize their schemas to adopt future releaes. Whereas the CLI commands, tracker, and autodoc can all be easily improved with non-breaking releases.
With this in mind, the bulk of our up-front development time has been focused on the schema design & codegen. The autodoc is in an MVP state at the time of our public release, and we have full intention to improve it's UI/UX in future releases. Orgs that adopt Voltage can expect the autodoc to become infinitely more useful (and usable) over time.
Credits 🌟
Voltage was an ambitious project, and it couldn't have been built without help from some special people. 💙
Special thanks to:
- Kirk Hlavka (Analytics Engineer)
- Chris Stone (Software Engineer)
- Jeff Dwyer (Advisor)
- Ernie Park (Advisor)
- Francois Ward (Advisor)
Want to help? Reach out to Matt Rheault on LinkedIn if you want to contribute to Voltage.